从profiling谈起到可视化利器的火焰图 - Python性能分析器
前言
在开始之前,需要说明本文的行文的主线是从CPU分析器为主,在line by line分析器的时候会提到一个类似line by line的内存分析器。
Python众所周知是一个“慢慢”的语言,但不代表我们不能对性能有所追求,一名长期从事Python开发的程序员与新入门的Python的程序员代码效率往往能有几倍速度的差异,工欲善其事必先利其器,本文来叨叨Python性能分析器的那些事。
分析器分类
大体上目前的Python的CPU性能分析器,有这几个分类和实现:
| 类别 | 名字 |
|---|---|
| timer | time |
| timer | timeit |
| Tracing | cProfile |
| Tracing | profile |
| Tracing | hotshot (已经在3中移除) |
| Tracing | gprof (greenlet) |
| Sampling | pyflame |
| Sampling | stacksampler |
| Sampling | statprof |
| Sampling | vmprof |
| Sampling | pyinstrument |
| Sampling | python-flamegraph |
| Sampling | plop |
| Tracing(Line-by-line) | line_profiler |
原理简述
Timer 是最粗粒度的分析方式,直接使用unix的time分析或者使用timeit等模块简单暴力的计算运行状况的分析。
Tracing (Deterministic)分析追踪了所有函数调用、函数返回和异常报告,提供了其准确的执行时间等。其中,cProfiles 使用PyEval_SetProfile设置回调:看_lsprof.c的693行(cProfile是用Isprof实现的)
Sampling分析是一种采样分析。通过setitimer让系统定时发起信号,处理每一次信号的时候记录当前栈,通常是每20ms一次记录。stacksampler.py是一个非常好的学习脚本,大约100行,包含了一个Sampling分析的所有代码,本文这次用单独讲到plop并画出火焰图。
Line-by-line分析是粒度最细的分析,如同Tracing一样,追踪了所有函数每一行调用、函数返回和异常报告,提供了其准确的执行时间等。python比较出名的line分析工具就是line_profiler
Timer
Time
暴力和简单的美学,传统的 unix time 工具。
1 | $ time python yourprogram.py |
real – 指的是实际耗时
user – 指的是内核之外的 CPU 耗时
sys – 指的是花费在内核特定函数的 CPU 耗时
内建函数 timeit
内建函数是最简单的g工具统计分析函数执行时间的方式。可以通过简单的import,直接调用目标测试函数,获取运行时间。
1 | import timeit |
输出
1 | [1.7263835030025803, 1.7080924350011628, 1.6802870190003887, 1.6736655100103235, 1.7003267239924753] |
也可以使用命令行方式调用
1 | python -m timeit your_function |
Tracing (Deterministic) Profiling
cProfile 和 profile
Python标准库提供了2个不同的性能分析器:
- cProfile,基于lsprof,是C的一个扩展应用,其合理的运行开销,适合分析运行时间较长的。
- profile,一个纯python模块,它的接口和cProfile一致。在分析程序时,增加了很大的运行开销。如果想扩展profiler的功能,可以试着继承这个模块
简单的分析一个函数,可以这么做
1 | import cProfile |
然后你会得到这样的一个输出:
1 | 197 function calls (192 primitive calls) in 0.002 seconds |
197 function calls是总次数调用,每一列分别是:
| 列名 | 含义 |
|---|---|
| ncalls | 调用次数 |
| tottime | 给定函数的所有执行时间(排除了子函数执行时间) |
| percall | tottime 除以 ncalls |
| cumtime | 所有执行时间,包括子函数 |
| percall | cumtime 除以 primitive calls |
| filename:lineno(function) | 文件名:行号(函数名) |
也是支持命令行分析的:
1 | python -m cProfile [-o output_file] [-s sort_order] <your_script.py> |
Line by Line Profiling
line_profiler
首先需要安装line_profiler
1 | pip install line_profiler |
安装完成后,你将获得一个新模块称为 line_profiler 和 kernprof.py 可执行脚本。
为了使用这个工具,首先在你想测量的函数上设置 @profile 修饰符。不用担心,为了这个修饰符,你不需要引入任何东西。kernprof.py 脚本会在运行时自动注入你的脚本。
primes.py
1 |
|
一旦你得到了你的设置了修饰符 @profile 的代码,使用 kernprof.py 运行这个脚本。
1 | kernprof.py -l -v primes.py |
-l 选项告诉 kernprof 把修饰符 @profile 注入你的脚本,-v 选项告诉 kernprof 一旦你的脚本完成后,展示计时信息。这是一个以上脚本的类似输出:
1 | Wrote profile results to primes.py.lprof |
寻找 hits 值比较高的行或是一个高时间间隔。这些地方有最大的优化改进空间。
额外提一下 memory_profiler
memory_profiler 是Fabian Pedregosa 仿照 Robert Kern 的 line_profiler 实现的一个内存分析器,用法类似。
首先通过 pip 安装它:
1 | $ pip install -U memory_profiler |
在这里建议安装 psutil 是因为该包能提升 memory_profiler 的性能。
像 line_profiler 一样, memory_profiler 要求在你设置 @profile 来修饰你的函数:
1 |
|
运行如下命令来显示函数使用了多少内存:
1 | $ python -m memory_profiler primes.py |
一旦程序退出,可以看到这样的输出:
1 | Filename: primes.py |
Sampling Profiling
原理实现
Python的采样分析器是通过系统调用setitimer实现的.
stacksampler.py只有100多行,它把Python函数注册成信号处理器,该函数被传送到你的Python程序的当前堆栈中。所以stacksampler.py信号处理器注册是非常简单的:
1 | def _sample(self, signum, frame): |
它只是将堆栈从堆栈帧中取出来并且增加堆栈查看计数.
再看看其他的实现
stacksampler (Python): stacksampler.py line 51
statprof (Python): statprof.py line 239
vmprof (Python): vmprof_unix.c line 294
plop
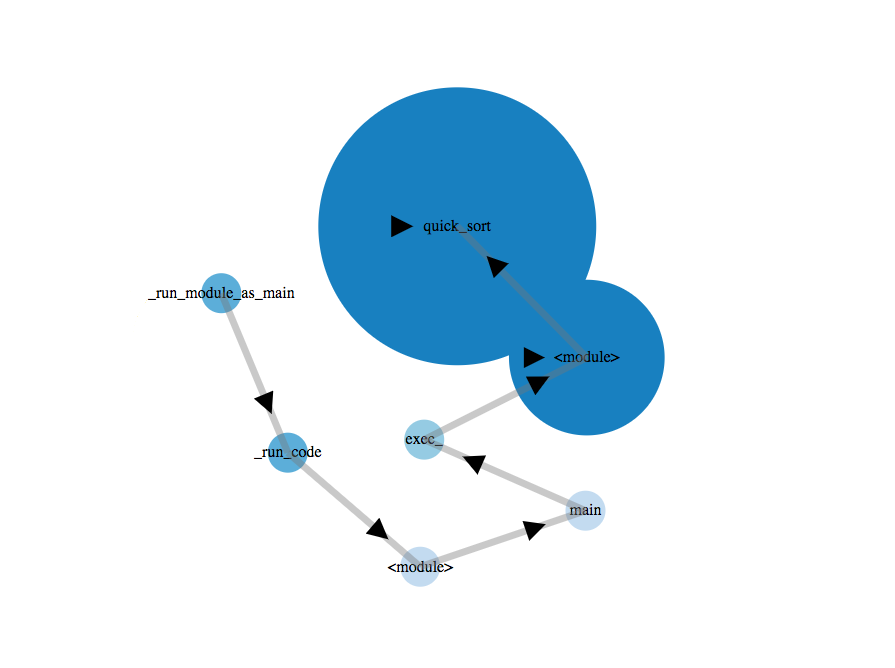
plop是Tornado的作者Ben编写Sampling分析器,自带一个可视化的Web,方便并且低消耗的分析器。
命令行启动时最方便的使用方式:
1 | python -m plop.collector script.py |
执行完成后,在当前目录下会出现profiles文件夹,在启动viewer,在浏览器中输入http://localhost:8080就可以查看可视化的采样分析咯
1 | python -m plop.viewer |
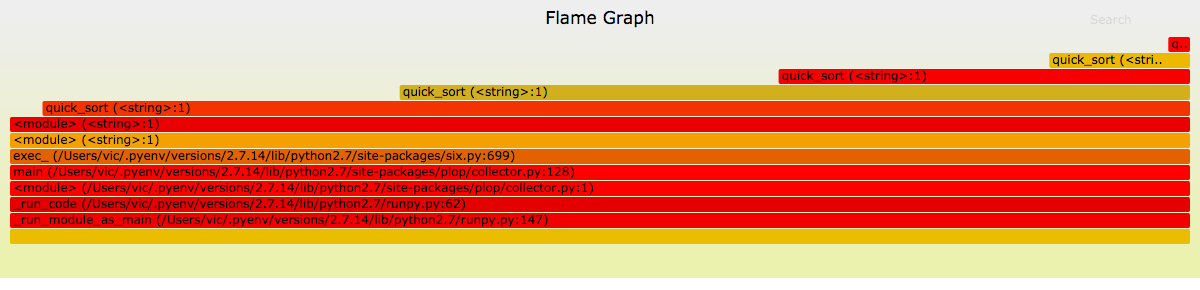
plop 获取火焰图
首先,我们先获得flamegraph格式的输出:
1 | python -m plop.collector -f flamegraph test.py |
然后在profiles文件夹中,可以看见生成了test.py-20171226-1242-29.flame类似以.flame结尾的文件。这个文件就是我们用来生成火焰图的文件,接下来我们生成火焰图。
我们需要FlameGraph这里项目将plop生成的flamegraph格式转换成svg图像。
1 | git clone git@github.com:brendangregg/FlameGraph.git |
然后使用它的flamegraph.pl脚本生成svg图像,这是一个perl脚本,如果系统是mac或者linux可以直接使用,如果是windows可能需要额外安装。
1 | ./FlameGraph/flamegraph.pl profiles/test.py-20171227-1314-51.flame > profiles/flame.svg |
总结
Python性能分析,无论是最粗粒度的timeit或者是最细粒度的line_profiler,我们都能找到其的用武之地,没有最好的工具,只有更棒的想法。
Reference
27.4. The Python Profilers — Python 3.6.4 documentation
26.4. The Python Profilers — Python 2.7.14 documentation
Profiling Python
memory_profiler
line_profiler
How do Ruby & Python profilers work?
转载请注明来源
由于水平有限,行文难免出错,恳请读者批评指正。
